Continuous Random Variable
首先回顧以前提過的相對次數累積分布圖 Relative frequency histogram 它有幾個需要注意的重點, 以及當推廣到連續型的隨機變數時情形.
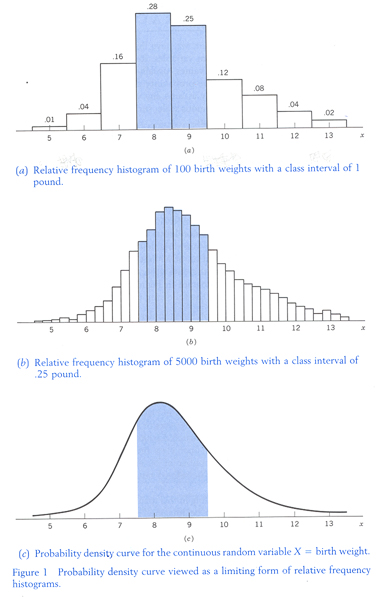
Because probability is interpreted as long-run relative frequency, the curve obtained as the limiting form of the relative frequency histograms represents the manner in which the total probability 1 is distributed over the interval of possible values of he random variable X. This curve is called the probability density curve of the continuous random variable X. The mathematical function f(x) whose graph produces this curve is called the probability density function (pdf) of the continuous random variable X.